
Page 2 - 64 12 27 TFPA EXPORT January-November 2021
P. 2
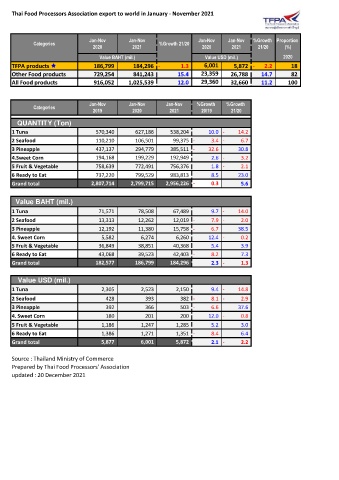
Thai Food Processors Association export to world in January - November 2021
Jan-Nov Jan-Nov Jan-Nov Jan-Nov %Growth Proportion
Categories %Growth 21/20
2020 2021 2020 2021 21/20 (%)
Value BAHT (mil.) Value USD (mil.) 2020
TFPA products 186,799 184,296 - 1.3 6,001 5,872 - 2.2 18
Other Food products 729,254 841,243 15.4 23,359 26,788 14.7 82
All Food products 916,052 1,025,539 12.0 29,360 32,660 11.2 100
Jan-Nov Jan-Nov Jan-Nov %Growth %Growth
Categories
2019 2020 2021 20/19 21/20
QUANTITY (Ton)
1 Tuna 570,340 627,186 538,204 10.0 - 14.2
2 Seafood 110,210 106,501 99,375 - 3.4 - 6.7
3 Pineapple 437,137 294,779 385,511 - 32.6 30.8
4.Sweet Corn 194,168 199,229 192,949 2.6 - 3.2
5 Fruit & Vegetable 758,639 772,491 756,376 1.8 - 2.1
6 Ready to Eat 737,220 799,529 983,813 8.5 23.0
Grand total 2,807,714 2,799,715 2,956,226 - 0.3 5.6
Value BAHT (mil.)
1 Tuna 71,571 78,508 67,489 9.7 - 14.0
2 Seafood 13,313 12,262 12,019 - 7.9 - 2.0
3 Pineapple 12,192 11,380 15,758 - 6.7 38.5
4. Sweet Corn 5,582 6,274 6,260 12.4 - 0.2
5 Fruit & Vegetable 36,849 38,851 40,368 5.4 3.9
6 Ready to Eat 43,068 39,523 42,403 - 8.2 7.3
Grand total 182,577 186,799 184,296 2.3 - 1.3
Value USD (mil.)
1 Tuna 2,305 2,523 2,150 9.4 - 14.8
2 Seafood 428 393 382 - 8.1 - 2.9
3 Pineapple 392 366 503 - 6.6 37.6
4. Sweet Corn 180 201 200 12.0 - 0.8
5 Fruit & Vegetable 1,186 1,247 1,285 5.2 3.0
6 Ready to Eat 1,386 1,271 1,351 - 8.4 6.4
Grand total 5,877 6,001 5,872 2.1 - 2.2
Source : Thailand Ministry of Commerce
Prepared by Thai Food Processors' Association
updated : 20 December 2021