
Page 4 - 64 12 27 TFPA EXPORT January-November 2021
P. 4
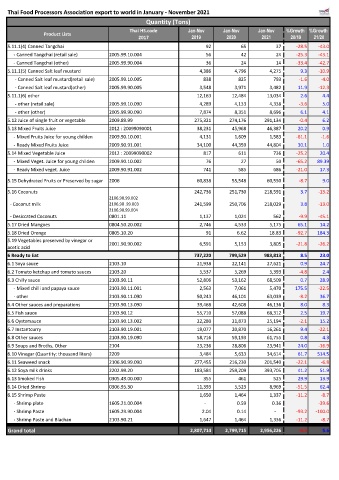
Thai Food Processors Association export to world in January - November 2021
                                                    Quantity (Tons)
                                               Thai HS.code        Jan-Nov     Jan-Nov      Jan-Nov  %Growth  %Growth
                Product Lists
                                                  2017              2019         2020        2021      20/19   21/20
    5.11.1(4) Canned Tangchai                                                          92                       65                       37  -28.5  -43.0
         - Canned Tangchai (retail sale)  2005.99.10.004                               56                       42                       24  -25.3  -43.1
         - Canned Tangchai (other)     2005.99.90.004                                  36                       24                       14  -33.4  -42.7
    5.11.1(5) Canned Salt leaf mustard                                           4,386                  4,796                  4,275  9.3  -10.9
          - Canned Salt leaf mustard(retail sale)  2005.99.10.005                      838                     825                     793  -1.6  -4.0
          - Canned Salt leaf mustard(other)  2005.99.90.005                      3,548                  3,971                  3,482  11.9  -12.3
    5.11.1(6) other                                                            12,163                12,484                13,034  2.6  4.4
          - other (retail sale)        2005.99.10.090                            4,289                  4,133                  4,338  -3.6  5.0
          - other (other)              2005.99.90.090                            7,874                  8,351                  8,696  6.1  4.1
    5.12 Juice of single fruit or vegetable  2009.89.99                      275,321              274,176              291,134  -0.4  6.2
    5.13 Mixed Fruits Juice            2012 : 20099090001                      38,231                45,968                46,387  20.2  0.9
         - Mixed Fruits Juice for young childen  2009.90.10.001                  4,131                  1,609                  1,583  -61.1  -1.6
         - Ready Mixed Fruits Juice    2009.90.91.001                          34,100                44,359                44,804  30.1  1.0
    5.14 Mixed Vegetable Juice         2012 : 20099090002                            817                     611                     736  -25.2  20.4
         - Mixed Veget. Juice for young childen  2009.90.10.002                        76                       27                       50  -65.2  89.39
         - Ready Mixed veget. Juice    2009.90.91.002                                741                     585                     686  -21.0  17.3
    5.15 Dehydrated Fruits or Preserved by sugar  2006                         60,838                55,548                60,550  -8.7  9.0

    5.16 Coconuts                                                            242,736              251,730              218,591  3.7  -13.2
                                       2106.90.99.002
      - Coconut milk                   2106.90 .99.003                       241,599              250,706              218,029  3.8  -13.0
                                       2106.90.99.004
      - Desiccated Coconuts            0801.11                                   1,137                  1,024                     562  -9.9  -45.1
    5.17 Dried Mangoes                 0804.50.20.002                            2,746                  4,533                  5,175  65.1  14.2
    5.18 Dried Orenge                  0805.10.20                                      91                    6.62                  18.83  -92.7  184.3
    5.19 Vegetables preserved by vinegar or
                                       2001.90.90.002                            6,591                  5,153                  3,805  -21.8  -26.2
    acetic acid
                                                                                                       #DIV/0!  #DIV/0!
    6 Ready to Eat                                                           737,220              799,529              983,813  8.5  23.0
    6.1 Soya sauce                     2103.10                                 21,938                22,141                27,621  0.9  24.7
    6.2 Tomato ketchup and tomato sauces  2103.20                                5,537                  5,269                  5,393  -4.8  2.4
    6.3 Chilly sauce                   2103.90.11                              52,806                53,162                68,509  0.7  28.9
         - Mixed chilli and papaya sauce  2103.90.11.001                         2,563                  7,061                  5,470  175.5  -22.5
         - other                       2103.90.11.090                          50,243                46,101                63,039  -8.2  36.7
    6.4 Other sauces and preparations   2103.90.13.090                         39,468                42,608                46,136  8.0  8.3
    6.5 Fish sauce                     2103.90.12                              55,710                57,088                68,312  2.5  19.7
    6.6 Oystersauce                    2103.90.13.002                          22,280                21,873                25,194  -2.1  15.2
    6.7 Instantcurry                   2103.90.19.001                          19,077                20,870                16,261  9.4  -22.1
    6.8 Other sauces                   2103.90.19.090                          58,716                59,193                61,755  0.8  4.3
    6.9 Soups and Broths, Other        2104                                    23,236                28,806                23,941  24.0  -16.9
    6.10 Vinegar (Quantity: thousand liters)  2209                               3,484                  5,633                34,614  61.7  514.5
    6.11 Seaweed snack                 2106.90.99.090                        277,455              216,230              201,540  -22.1  -6.8
    6.12 Soya milk drinks              2202.99.20                            183,584              259,209              393,705  41.2  51.9
    6.13 Smoked Fish                   0305.49.00.000                                355                     461                     525  29.9  13.9
    6.14 Dried Shrimp                  0306.95.30                              11,393                  5,523                  8,969  -51.5  62.4
    6.15 Shrimp Paste                                                            1,650                  1,464                  1,337  -11.2  -8.7
         - Shrimp plate                1605.21.00.004                                -                    0.59                    0.36  -39.6
         - Shrimp Paste                1605.29.90.004                              2.04                    0.14                      -  -93.2  -100.0
         - Shrimp Paste and Blachan    2103.90.21                                1,647                  1,464                  1,336  -11.2  -8.7
    Grand total                                                           2,807,714           2,799,715           2,956,226  -0.3  5.6