
Page 5 - 64 12 27 TFPA EXPORT January-November 2021
P. 5
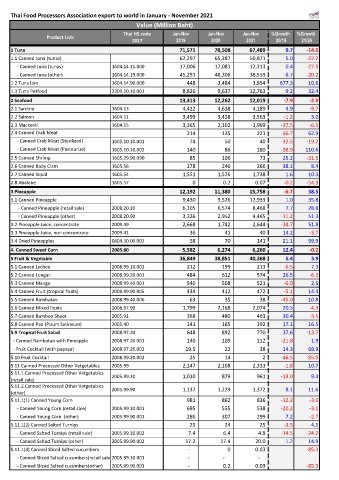
Thai Food Processors Association export to world in January - November 2021
                                                 Value (Million Baht)
                                            Thai HS.code      Jan-Nov     Jan-Nov     Jan-Nov   %Growth   %Growth
                 Product Lists
                                               2017            2019        2020        2021       20/19    21/20
     1 Tuna                                                            71,571             78,508             67,489  9.7  -14.0
     1.1 Canned tuna (tunas)                                           62,297             65,387             50,871  5.0  -22.2
          - Canned tuna (tunas)         1604.14.11.000                 17,006             17,081             12,313  0.4  -27.9
          - Canned tuna (other)         1604.14.19.000                 45,291             48,306             38,559  6.7  -20.2
     1.2 Tuna loin                      1604.14.90.000                      448               3,484               3,854  677.3  10.6
     1.3 Tuna Petfood                   2309.10.10.001                   8,826               9,637             12,763  9.2  32.4
                                                                                                 #DIV/0!  #DIV/0!
     2 Seafood                                                         13,313             12,262             12,019  -7.9  -2.0
     2.1 Sardine                        1604.13                          4,422               4,638               4,189  4.9  -9.7
     2.2 Salmon                         1604.11                          3,499               3,458               3,563  -1.2  3.0
     2.3 Mackerel                       1604.15                          3,365               2,102               1,969  -37.5  -6.3
     2.4 Canned Crab Meat                                                   214                   135                   221  -36.7  62.9
          - Canned Crab Meat (Sterilized)  1605.10.10.001                     74                     50                     40  -32.5  -19.2
          - Canned Crab Meat (Pasteurize)  1605.10.10.002                   140                     86                   180  -38.9  110.6
     2.5 Canned Shrimp                  1605.29.90.090                        85                   106                     73  25.2  -31.5
     2.6 Canned Baby Clam               1605.56                             178                   246                   266  38.1  8.4
     2.7 Canned Squid                   1605.54                          1,551               1,576               1,738  1.6  10.3
     2.8 Abalone                        1605.57                                  0                    0.2                 0.07  -0.2  -54.3
                                                                                                 #DIV/0!  #DIV/0!
     3 Pineapple                                                       12,192             11,380             15,758  -6.7  38.5
     3.1 Canned Pineapple                                                9,430               9,526             12,933  1.0  35.8
           - Canned Pineapple (retail sale)  2008.20.10                  6,105               6,574               8,468  7.7  28.8
           - Canned Pineapple (other)   2008.20.90                       3,326               2,952               4,465  -11.2  51.3
     3.2 Pineapple Juice, concentrate   2009.49                          2,668               1,742               2,644  -34.7  51.8
     3.3 Pineapple Juice, non concentrate  2009.41                            36                     41                     40  14.2  -3.7
     3.4 Dried Pineapples               0804.30.00.002                        58                     70                   141  21.1  99.9
                                                                                                  3,312  #DIV/0!  #DIV/0!
     4. Canned Sweet Corn               2005.80                          5,582               6,274               6,260  12.4  -0.2
                                                                                                 #DIV/0!  #DIV/0!
     5 Fruit & Vegetable                                               36,849             38,851             40,368  5.4  3.9
     5.1 Canned Lychee                  2008.99.10.001                      212                   199                   213  -6.5  7.3
     5.2 Canned Longan                  2008.99.20.001                      484                   612                   574  26.5  -6.2
     5.3 Canned Mango                   2008.99.40.001                      540                   508                   521  -6.0  2.5
     5.4 Canned Fruit (tropical fruits)  2008.99.90.005                     434                   412                   472  -5.1  14.4
     5.5 Canned Rambutan                2008.99.40.006                        63                     35                     38  -45.0  10.8
     5.6 Canned Mixed Fruits            2008.97.90                       1,799               2,168               2,074  20.5  -4.3
     5.7 Canned Bamboo Shoot            2005.91                             368                   480                   463  30.4  -3.5
     5.8 Canned Pea (Pisum Satinvum)    2005.40                             141                   165                   192  17.1  16.5
     5.9 Tropical Fruit Salad           2008.97.20                          648                   892                   770  37.6  -13.7
       - Canned Rambutan with Pineapple  2008.97.20.001                     140                   109                   112  -21.8  1.9
       - Fruit Cocktail (with papaya)   2008.97.20.002                     19.5                     22                     38  14.3  68.9
     5.10 Fruit Cocktail                2008.99.20.002                        25                     14                       2  -46.5  -85.9
     5.11 Canned Processed Other Vetgetables  2005.99                    2,147               2,108               2,333  -1.8  10.7
     5.11.1 Canned Processed Other Vetgetables
                                        2005.99.10                       1,010                   879                   961  -13.0  9.4
     (retail sale)
     5.11.2 Canned Processed Other Vetgetables
                                        2005.99.90                       1,137               1,229               1,372  8.1  11.6
     (other)
     5.11.1(1) Canned Young Corn                                            981                   862                   836  -12.2  -3.0
          - Canned Young Corn (retail sale)  2005.99.10.001                   695                   555                   538  -20.2  -3.1
          - Canned Young Corn  (other)  2005.99.90.001                      286                   307                   299  7.2  -2.7
     5.11.1(2) Canned Salted Turnips                                          25                     24                     25  -3.5  4.5
          - Canned Salted Turnips (retail sale)  2005.99.10.002                    7.4                    6.4                    4.8  -14.5  -24.2
          - Canned Salted Turnips (other)  2005.99.90.002                  17.2                 17.4                 20.0  1.2  14.9
     5.11.1(3) Canned Sliced Salted cucumbers                                -                       0                 0.03  -85.3
          - Canned Sliced Salted cucumbers(retail sale)2005.99.10.003                    -                    -                    -
          - Canned Sliced Salted cucumbers(other)  2005.99.90.003                    -                    0.2                 0.03  -85.3