
Page 3 - 64 12 27 TFPA EXPORT January-November 2021
P. 3
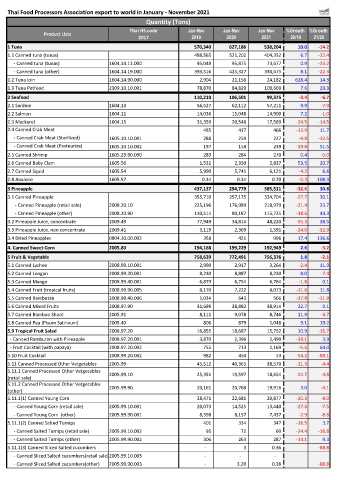
Thai Food Processors Association export to world in January - November 2021
                                                    Quantity (Tons)
                                               Thai HS.code        Jan-Nov     Jan-Nov      Jan-Nov  %Growth  %Growth
                Product Lists
                                                  2017              2019         2020        2021      20/19   21/20
    1 Tuna                                                                   570,340              627,186              538,204  10.0  -14.2
    1.1 Canned tuna (tunas)                                                  488,565              521,202              404,352  6.7  -22.4
         - Canned tuna (tunas)         1604.14.11.000                          95,049                95,875                73,677  0.9  -23.2
         - Canned tuna (other)         1604.14.19.000                        393,516              425,327              330,675  8.1  -22.3
    1.2 Tuna loin                      1604.14.90.000                            2,904                21,156                24,182  628.4  14.3
    1.3 Tuna Petfood                   2309.10.10.001                          78,870                84,829              109,669  7.6  29.3
                                                                                                       #DIV/0!  #DIV/0!
    2 Seafood                                                                110,210              106,501                99,375  -3.4  -6.7
    2.1 Sardine                        1604.13                                 56,527                62,112                57,211  9.9  -7.9
    2.2 Salmon                         1604.11                                 14,036                15,048                14,900  7.2  -1.0
    2.3 Mackerel                       1604.15                                 31,359                20,548                17,569  -34.5  -14.5
    2.4 Canned Crab Meat                                                             485                     417                     466  -13.9  11.7
         - Canned Crab Meat (Sterilized)  1605.10.10.001                             288                     259                     227  -9.8  -12.5
         - Canned Crab Meat (Pasteurize)  1605.10.10.002                             197                     158                     239  -19.8  51.5
    2.5 Canned Shrimp                  1605.29.90.090                                283                     284                     270  0.4  -5.0
    2.6 Canned Baby Clam               1605.56                                   1,531                  2,350                  2,837  53.5  20.7
    2.7 Canned Squid                   1605.54                                   5,990                  5,741                  6,121  -4.2  6.6
    2.8 Abalone                        1605.57                                     0.34                    0.34                    0.70  -0.3  108.3
                                                                                                       #DIV/0!  #DIV/0!
    3 Pineapple                                                              437,137              294,779              385,511  -32.6  30.8
    3.1 Canned Pineapple                                                     355,710              257,175              334,704  -27.7  30.1
          - Canned Pineapple (retail sale)  2008.20.10                       225,196              176,989              218,979  -21.4  23.7
          - Canned Pineapple (other)   2008.20.90                            130,514                80,187              115,725  -38.6  44.3
    3.2 Pineapple Juice, concentrate   2009.49                                 77,949                34,814                48,220  -55.3  38.5
    3.3 Pineapple Juice, non concentrate  2009.41                                3,119                  2,369                  1,591  -24.0  -32.9
    3.4 Dried Pineapples               0804.30.00.002                                358                     421                     996  17.4  136.6
                                                                               54,739                55,171                     144  0.8  -99.7
    4. Canned Sweet Corn               2005.80                               194,168              199,229              192,949  2.6  -3.2
                                                                                                       #DIV/0!  #DIV/0!
    5 Fruit & Vegetable                                                      758,639              772,491              756,376  1.8  -2.1
    5.1 Canned Lychee                  2008.99.10.001                            2,990                  2,917                  3,264  -2.4  11.9
    5.2 Canned Longan                  2008.99.20.001                            8,230                  8,887                  8,230  8.0  -7.4
    5.3 Canned Mango                   2008.99.40.001                            6,879                  6,754                  6,764  -1.8  0.1
    5.4 Canned Fruit (tropical fruits)  2008.99.90.005                           8,170                  7,222                  8,073  -11.6  11.8
    5.5 Canned Rambutan                2008.99.40.006                            1,034                     643                     566  -37.8  -11.9
    5.6 Canned Mixed Fruits            2008.97.90                              31,699                38,882                38,914  22.7  0.1
    5.7 Canned Bamboo Shoot            2005.91                                   8,111                  9,078                  8,746  11.9  -3.7
    5.8 Canned Pea (Pisum Satinvum)    2005.40                                       806                     879                  1,048  9.1  19.2
    5.9 Tropical Fruit Salad           2008.97.20                              16,855                18,687                15,752  10.9  -15.7
      - Canned Rambutan with Pineapple  2008.97.20.001                           3,870                  2,396                  2,490  -38.1  3.9
      - Fruit Cocktail (with papaya)   2008.97.20.002                                755                     713                  1,169  -5.6  64.0
    5.10 Fruit Cocktail                2008.99.20.002                                982                     450                       53  -54.2  -88.1
    5.11 Canned Processed Other Vetgetables  2005.99                           45,512                40,365                38,570  -11.3  -4.4
    5.11.1 Canned Processed Other Vetgetables
                                       2005.99.10                              25,351                19,597                18,654  -22.7  -4.8
    (retail sale)
    5.11.2 Canned Processed Other Vetgetables
                                       2005.99.90                              20,161                20,768                19,916  3.0  -4.1
    (other)
    5.11.1(1) Canned Young Corn                                                28,471                22,681                20,877  -20.3  -8.0
         - Canned Young Corn (retail sale)  2005.99.10.001                     20,073                14,525                13,440  -27.6  -7.5
         - Canned Young Corn  (other)  2005.99.90.001                            8,398                  8,157                  7,437  -2.9  -8.8
    5.11.1(2) Canned Salted Turnips                                                  401                     334                     347  -16.5  3.7
         - Canned Salted Turnips (retail sale)  2005.99.10.002                         95                       72                       60  -24.4  -16.8
         - Canned Salted Turnips (other)  2005.99.90.002                             306                     263                     287  -14.1  9.3
    5.11.1(3) Canned Sliced Salted cucumbers                                         -                          3                    0.36  -88.8
         - Canned Sliced Salted cucumbers(retail sale)2005.99.10.003                      -                      -                      -
         - Canned Sliced Salted cucumbers(other)  2005.99.90.003                      -                    3.20                    0.36  -88.8