Page 4 - 9. TFPA export to World in Januaty-September 2021
P. 4

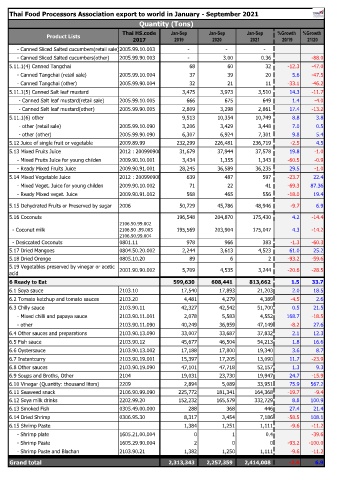
Thai Food Processors Association export to world in January - September 2021
                                                  Quantity (Tons)
                                            Thai HS.code     Jan-Sep      Jan-Sep       Jan-Sep   %Growth   %Growth
                 Product Lists
                                                2017          2019          2020         2021       20/19    21/20
         - Canned Sliced Salted cucumbers(retail sale)2005.99.10.003                   -                   -                   -
         - Canned Sliced Salted cucumbers(other)  2005.99.90.003                   -                  3.00                  0.36  -88.0
    5.11.1(4) Canned Tangchai                                                68                     60                     32  -12.3  -47.0
         - Canned Tangchai (retail sale)   2005.99.10.004                     37                     39                     20  5.6  -47.5
         - Canned Tangchai (other)         2005.99.90.004                     32                     21                     11  -33.1  -46.2
    5.11.1(5) Canned Salt leaf mustard                                  3,475                3,973                3,510  14.3  -11.7
          - Canned Salt leaf mustard(retail sale)  2005.99.10.005                   666                   675                   649  1.4  -4.0
          - Canned Salt leaf mustard(other)  2005.99.90.005                2,809                3,298                2,861  17.4  -13.2
    5.11.1(6) other                                                     9,513              10,354              10,749  8.8  3.8
          - other (retail sale)            2005.99.10.090                3,206                3,429                3,448  7.0  0.5
          - other (other)                  2005.99.90.090                6,307                6,924                7,301  9.8  5.4
    5.12 Juice of single fruit or vegetable  2009.89.99              232,299            226,481            236,719  -2.5  4.5
    5.13 Mixed Fruits Juice                2012 : 20099090001            31,679              37,944              37,578  19.8  -1.0
         - Mixed Fruits Juice for young childen  2009.90.10.001                3,434                1,355                1,343  -60.5  -0.9
         - Ready Mixed Fruits Juice        2009.90.91.001              28,245              36,589              36,235  29.5  -1.0
    5.14 Mixed Vegetable Juice             2012 : 20099090002                 639                   487                   597  -23.7  22.4
         - Mixed Veget. Juice for young childen  2009.90.10.002                     71                     22                     41  -69.3  87.36
         - Ready Mixed veget. Juice        2009.90.91.002                   568                   465                   556  -18.0  19.4
    5.15 Dehydrated Fruits or Preserved by sugar  2006                 50,729              45,786              48,946  -9.7  6.9

    5.16 Coconuts                                                    196,548            204,870            175,430  4.2  -14.4
                                           2106.90.99.002
      - Coconut milk                       2106.90 .99.003            195,569            203,904            175,047  4.3  -14.2
                                           2106.90.99.004
      - Desiccated Coconuts                0801.11                         978                   966                   383  -1.3  -60.3
    5.17 Dried Mangoes                     0804.50.20.002                2,244                3,613                4,523  61.0  25.2
    5.18 Dried Orenge                      0805.10.20                        89                      6                      2  -93.2  -59.6
    5.19 Vegetables preserved by vinegar or acetic   2001.90.90.002                5,709                4,535                3,244  -20.6  -28.5
    acid
                                                                                                    #DIV/0!  #DIV/0!
    6 Ready to Eat                                                 599,630          608,441          813,662  1.5  33.7
    6.1 Soya sauce                         2103.10               17,540       17,893       21,203       2.0    18.5
    6.2 Tomato ketchup and tomato sauces   2103.20                4,481        4,279        4,389      -4.5     2.6
    6.3 Chilly sauce                       2103.90.11            42,327       42,542       51,700       0.5    21.5
         - Mixed chilli and papaya sauce   2103.90.11.001         2,078        5,583        4,552     168.7   -18.5
         - other                           2103.90.11.090        40,249       36,959       47,149      -8.2    27.6
    6.4 Other sauces and preparations      2103.90.13.090        33,007       33,687       37,832       2.1    12.3
    6.5 Fish sauce                         2103.90.12            45,677       46,504       54,213       1.8    16.6
    6.6 Oystersauce                        2103.90.13.002        17,188       17,800       19,340       3.6     8.7
    6.7 Instantcurry                       2103.90.19.001        15,397       17,205       13,090      11.7   -23.9
    6.8 Other sauces                       2103.90.19.090        47,101       47,718       52,157       1.3     9.3
    6.9 Soups and Broths, Other            2104                  19,031       23,730       19,947      24.7   -15.9
    6.10 Vinegar (Quantity: thousand liters)  2209                2,894        5,089       33,951      75.9   567.2
    6.11 Seaweed snack                     2106.90.99.090       225,772      181,341      164,368     -19.7    -9.4
    6.12 Soya milk drinks                  2202.99.20           152,232      165,579      332,729       8.8   100.9
    6.13 Smoked Fish                       0305.49.00.000          288           368          446      27.4    21.4
    6.14 Dried Shrimp                      0306.95.30             8,317        3,454        7,186     -58.5   108.1
    6.15 Shrimp Paste                                             1,384        1,251        1,111      -9.6   -11.2
         - Shrimp plate                    1605.21.00.004            0             1          0.4             -39.6
         - Shrimp Paste                    1605.29.90.004            2             0            0     -93.2  -100.0
         - Shrimp Paste and Blachan        2103.90.21             1,382        1,250        1,111      -9.6   -11.2

    Grand total                                                 2,313,343       2,257,359       2,414,008  -2.4  6.9
   1   2   3   4   5   6   7   8   9