Page 2 - 9. TFPA export to World in Januaty-September 2021
P. 2

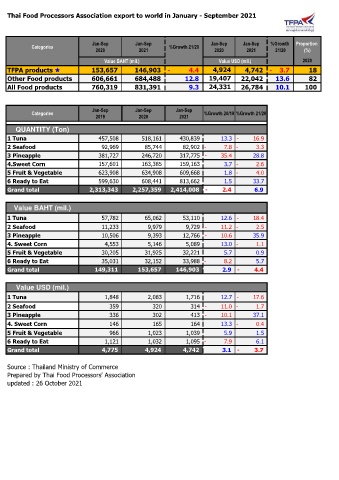
Thai Food Processors Association export to world in January - September 2021


                                 Jan-Sep         Jan-Sep                   Jan-Sep    Jan-Sep   %Growth   Proportion
            Categories                                      %Growth 21/20
                                   2020           2021                      2020        2021      21/20     (%)
                                      Value BAHT (mil.)                       Value USD (mil.)             2020
    TFPA products                  153,657        146,903  -            4.4       4,924       4,742  -      3.7          18
    Other Food products             606,661        684,488             12.8     19,407     22,042      13.6          82
    All Food products                760,319        831,391              9.3     24,331     26,784      10.1       100


                                 Jan-Sep         Jan-Sep       Jan-Sep
            Categories                                                   %Growth 20/19 %Growth 21/20
                                   2019           2020          2021
       QUANTITY (Ton)
    1 Tuna                               457,508             518,161          430,839            13.3 -          16.9
    2 Seafood                              92,969               85,744            82,902 -            7.8 -            3.3
    3 Pineapple                          381,727             246,720          317,775 -          35.4            28.8
    4.Sweet Corn                         157,601             163,385          159,163              3.7 -            2.6
    5 Fruit & Vegetable                  623,908             634,908          609,668              1.8 -            4.0
    6 Ready to Eat                       599,630             608,441          813,662              1.5            33.7
    Grand total                     2,313,343        2,257,359     2,414,008  -           2.4             6.9


      Value BAHT (mil.)
    1 Tuna                                 57,782               65,062            53,110            12.6 -          18.4

    2 Seafood                              11,233                9,979             9,729 -          11.2 -            2.5
    3 Pineapple                            10,506                9,393            12,766 -          10.6            35.9
    4. Sweet Corn                           4,553                5,146             5,089            13.0 -            1.1

    5 Fruit & Vegetable                    30,205               31,925            32,221              5.7              0.9
    6 Ready to Eat                         35,031               32,152            33,988 -            8.2              5.7
    Grand total                        149,311           153,657        146,903             2.9  -           4.4


       Value USD (mil.)

    1 Tuna                                  1,848                2,083             1,716            12.7 -          17.6
    2 Seafood                                  359                   320                314 -          11.0 -            1.7
    3 Pineapple                                336                   302                413 -          10.1            37.1
    4. Sweet Corn                              146                   165                164            13.3 -            0.4
    5 Fruit & Vegetable                        966                1,023             1,039              5.9              1.5


    6 Ready to Eat                          1,121                1,032             1,095 -            7.9              6.1
    Grand total                            4,775               4,924            4,742             3.1  -           3.7


    Source : Thailand Ministry of Commerce
    Prepared by Thai Food Processors' Association
    updated : 26 October 2021
   1   2   3   4   5   6   7