Page 3 - 9. TFPA export to World in Januaty-September 2021
P. 3

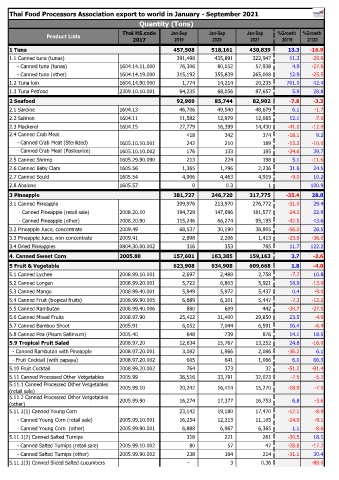
Thai Food Processors Association export to world in January - September 2021
                                                  Quantity (Tons)
                                            Thai HS.code     Jan-Sep      Jan-Sep       Jan-Sep   %Growth   %Growth
                 Product Lists
                                                2017          2019          2020         2021       20/19    21/20
    1 Tuna                                                         457,508          518,161          430,839  13.3  -16.9
    1.1 Canned tuna (tunas)                                          391,498            435,891            322,947  11.3  -25.9
         - Canned tuna (tunas)             1604.14.11.000              76,306              80,052              57,938  4.9  -27.6
         - Canned tuna (other)             1604.14.19.000            315,192            355,839            265,008  12.9  -25.5
    1.2 Tuna loin                          1604.14.90.000                1,774              14,214              20,235  701.0  42.4
    1.3 Tuna Petfood                       2309.10.10.001              64,235              68,056              87,657  5.9  28.8
                                                                                                    #DIV/0!  #DIV/0!
    2 Seafood                                                        92,969             85,744             82,902  -7.8  -3.3
    2.1 Sardine                            1604.13                     46,706              49,540              48,679  6.1  -1.7
    2.2 Salmon                             1604.11                     11,582              12,979              12,065  12.1  -7.0
    2.3 Mackerel                           1604.15                     27,779              16,399              14,430  -41.0  -12.0
    2.4 Canned Crab Meat                                                   418                   342                   374  -18.1  9.2
         - Canned Crab Meat (Sterilized)   1605.10.10.001                   242                   210                   189  -13.3  -10.0
         - Canned Crab Meat (Pasteurize)   1605.10.10.002                   176                   133                   185  -24.6  39.7
    2.5 Canned Shrimp                      1605.29.90.090                   213                   224                   198  5.1  -11.6
    2.6 Canned Baby Clam                   1605.56                      1,365                1,796                2,236  31.6  24.5
    2.7 Canned Squid                       1605.54                      4,906                4,463                4,919  -9.0  10.2
    2.8 Abalone                            1605.57                             0                    0.3                      1  100.9
                                                                                                    #DIV/0!  #DIV/0!
    3 Pineapple                                                    381,727          246,720          317,775  -35.4  28.8
    3.1 Canned Pineapple                                             309,976            213,970            276,772  -31.0  29.4
          - Canned Pineapple (retail sale)  2008.20.10               194,729            147,696            181,577  -24.2  22.9
          - Canned Pineapple (other)       2008.20.90                115,246              66,274              95,195  -42.5  43.6
    3.2 Pineapple Juice, concentrate       2009.49                     68,537              30,190              38,805  -56.0  28.5
    3.3 Pineapple Juice, non concentrate   2009.41                      2,898                2,206                1,413  -23.9  -36.0
    3.4 Dried Pineapples                   0804.30.00.002                   316                   353                   785  11.7  122.2
                                                                       54,739              55,171                   144  0.8  -99.7
    4. Canned Sweet Corn                   2005.80                 157,601          163,385          159,163  3.7  -2.6
                                                                                                  #DIV/0! #####
    5 Fruit & Vegetable                                            623,908          634,908          609,668  1.8  -4.0
    5.1 Canned Lychee                      2008.99.10.001                2,697                2,488                2,758  -7.7  10.8
    5.2 Canned Longan                      2008.99.20.001                5,722                6,803                5,921  18.9  -13.0
    5.3 Canned Mango                       2008.99.40.001                 5,949                5,972                5,437  0.4  -9.0
    5.4 Canned Fruit (tropical fruits)     2008.99.90.005                6,689                6,201                5,447  -7.3  -12.2
    5.5 Canned Rambutan                    2008.99.40.006                   880                   609                   442  -30.7  -27.5
    5.6 Canned Mixed Fruits                2008.97.90                  25,422              31,400              29,850  23.5  -4.9
    5.7 Canned Bamboo Shoot                2005.91                      6,052                7,044                6,591  16.4  -6.4
    5.8 Canned Pea (Pisum Satinvum)        2005.40                         648                   739                   876  14.1  18.5
    5.9 Tropical Fruit Salad               2008.97.20                  12,634              15,767              13,252  24.8  -16.0
      - Canned Rambutan with Pineapple     2008.97.20.001                3,082                1,966                2,086  -36.2  6.1
      - Fruit Cocktail (with papaya)       2008.97.20.002                   605                   641                1,066  6.0  66.3
    5.10 Fruit Cocktail                    2008.99.20.002                   764                   373                     32  -51.2  -91.4
    5.11 Canned Processed Other Vetgetables  2005.99                   36,516              33,791              32,023  -7.5  -5.2
    5.11.1 Canned Processed Other Vetgetables   2005.99.10              20,242              16,414              15,270  -18.9  -7.0
    (retail sale)
    5.11.2 Canned Processed Other Vetgetables   2005.99.90              16,274              17,377              16,753  6.8  -3.6
    (other)
    5.11.1(1) Canned Young Corn                                        23,142              19,180              17,470  -17.1  -8.9
         - Canned Young Corn (retail sale)  2005.99.10.001              16,254              12,213              11,105  -24.9  -9.1
         - Canned Young Corn  (other)      2005.99.90.001                6,888                6,967                6,365  1.1  -8.6
    5.11.1(2) Canned Salted Turnips                                        318                   221                   261  -30.5  18.1
         - Canned Salted Turnips (retail sale)  2005.99.10.002                     80                     57                     47  -28.8  -17.2
         - Canned Salted Turnips (other)   2005.99.90.002                   238                   164                   214  -31.1  30.4
    5.11.1(3) Canned Sliced Salted cucumbers                                -                      3                  0.36  -88.0
   1   2   3   4   5   6   7   8