Page 3 - 10. TFPA export to World in January-October 2021
P. 3

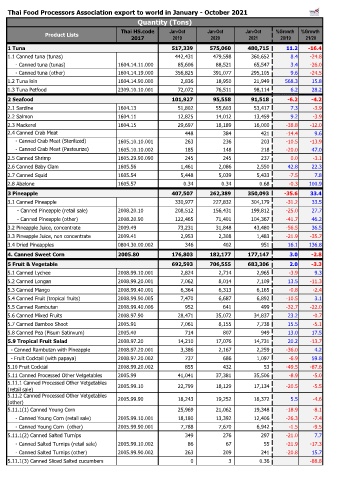
Thai Food Processors Association export to world in January - October 2021
                                                 Quantity (Tons)
                                           Thai HS.code      Jan-Oct      Jan-Oct      Jan-Oct    %Growth   %Growth
                 Product Lists
                                               2017           2019         2020         2021        20/19   21/20
    1 Tuna                                                        517,339          575,060          480,715  11.2  -16.4
    1.1 Canned tuna (tunas)                                         442,431            479,598            360,652  8.4  -24.8
         - Canned tuna (tunas)            1604.14.11.000              85,606              88,521              65,547  3.4  -26.0
         - Canned tuna (other)            1604.14.19.000            356,825            391,077            295,105  9.6  -24.5
    1.2 Tuna loin                         1604.14.90.000                2,836              18,950              21,949  568.3  15.8
    1.3 Tuna Petfood                      2309.10.10.001              72,072              76,511              98,114  6.2  28.2
                                                                                                   #DIV/0!  #DIV/0!
    2 Seafood                                                     101,927             95,558             91,518  -6.2  -4.2
    2.1 Sardine                           1604.13                     51,802              55,603              53,417  7.3  -3.9
    2.2 Salmon                            1604.11                     12,825              14,012              13,459  9.2  -3.9
    2.3 Mackerel                          1604.15                     29,697              18,189              16,000  -38.8  -12.0
    2.4 Canned Crab Meat                                                   448                   384                   421  -14.4  9.6
         - Canned Crab Meat (Sterilized)  1605.10.10.001                   263                   236                   203  -10.5  -13.9
         - Canned Crab Meat (Pasteurize)  1605.10.10.002                   185                   148                   218  -20.0  47.0
    2.5 Canned Shrimp                     1605.29.90.090                   245                   245                   237  0.0  -3.1
    2.6 Canned Baby Clam                  1605.56                       1,461                2,086                2,550  42.8  22.3
    2.7 Canned Squid                      1605.54                       5,448                5,039                5,433  -7.5  7.8
    2.8 Abalone                           1605.57                         0.34                  0.34                  0.68  -0.3  100.9
                                                                                                   #DIV/0!  #DIV/0!
    3 Pineapple                                                   407,507          262,389          350,093  -35.6  33.4
    3.1 Canned Pineapple                                            330,977            227,832            304,179  -31.2  33.5
          - Canned Pineapple (retail sale)  2008.20.10              208,512            156,431            199,812  -25.0  27.7
          - Canned Pineapple (other)      2008.20.90                122,465              71,401            104,367  -41.7  46.2
    3.2 Pineapple Juice, concentrate      2009.49                     73,231              31,848              43,480  -56.5  36.5
    3.3 Pineapple Juice, non concentrate  2009.41                       2,953                2,308                1,483  -21.9  -35.7
    3.4 Dried Pineapples                  0804.30.00.002                   346                   402                   951  16.1  136.8
                                                                      54,739              55,171                   144  0.8  -99.7
    4. Canned Sweet Corn                  2005.80                 176,803          182,177          177,147  3.0  -2.8
                                                                                                  #DIV/0! #####
    5 Fruit & Vegetable                                           692,593          706,555          683,306  2.0  -3.3
    5.1 Canned Lychee                     2008.99.10.001                2,824                2,714                2,965  -3.9  9.3
    5.2 Canned Longan                     2008.99.20.001                7,062                8,014                7,109  13.5  -11.3
    5.3 Canned Mango                      2008.99.40.001                 6,364                6,313                6,165  -0.8  -2.4
    5.4 Canned Fruit (tropical fruits)    2008.99.90.005                7,470                6,687                6,892  -10.5  3.1
    5.5 Canned Rambutan                   2008.99.40.006                   952                   641                   499  -32.7  -22.0
    5.6 Canned Mixed Fruits               2008.97.90                  28,471              35,072              34,837  23.2  -0.7
    5.7 Canned Bamboo Shoot               2005.91                       7,061                8,155                7,738  15.5  -5.1
    5.8 Canned Pea (Pisum Satinvum)       2005.40                          714                   807                   949  13.0  17.5
    5.9 Tropical Fruit Salad              2008.97.20                  14,210              17,076              14,731  20.2  -13.7
      - Canned Rambutan with Pineapple    2008.97.20.001                3,386                2,167                2,259  -36.0  4.2
      - Fruit Cocktail (with papaya)      2008.97.20.002                   737                   686                1,097  -6.9  59.8
    5.10 Fruit Cocktail                   2008.99.20.002                   855                   432                     53  -49.5  -87.6
    5.11 Canned Processed Other Vetgetables  2005.99                  41,041              37,381              35,506  -8.9  -5.0
    5.11.1 Canned Processed Other Vetgetables   2005.99.10              22,799              18,129              17,134  -20.5  -5.5
    (retail sale)
    5.11.2 Canned Processed Other Vetgetables   2005.99.90              18,243              19,252              18,372  5.5  -4.6
    (other)
    5.11.1(1) Canned Young Corn                                       25,969              21,062              19,348  -18.9  -8.1
         - Canned Young Corn (retail sale)  2005.99.10.001              18,180              13,392              12,406  -26.3  -7.4
         - Canned Young Corn  (other)     2005.99.90.001                7,788                7,670                6,942  -1.5  -9.5
    5.11.1(2) Canned Salted Turnips                                        349                   276                   297  -21.0  7.7
         - Canned Salted Turnips (retail sale)  2005.99.10.002                     86                     67                     55  -21.9  -17.3
         - Canned Salted Turnips (other)  2005.99.90.002                   263                   209                   241  -20.8  15.7
    5.11.1(3) Canned Sliced Salted cucumbers                                  0                      3                  0.36  -88.8
   1   2   3   4   5   6   7   8